Comprehensive data insights, market trends, and performance analytics for USA tourism and eVisa services
Updated continuously with the latest tourism and visa statistics
Real-time metrics and performance indicators
Comprehensive analysis of international visitor trends and patterns
Monthly visitor arrivals, top source countries, regional distribution, and economic impact by sector
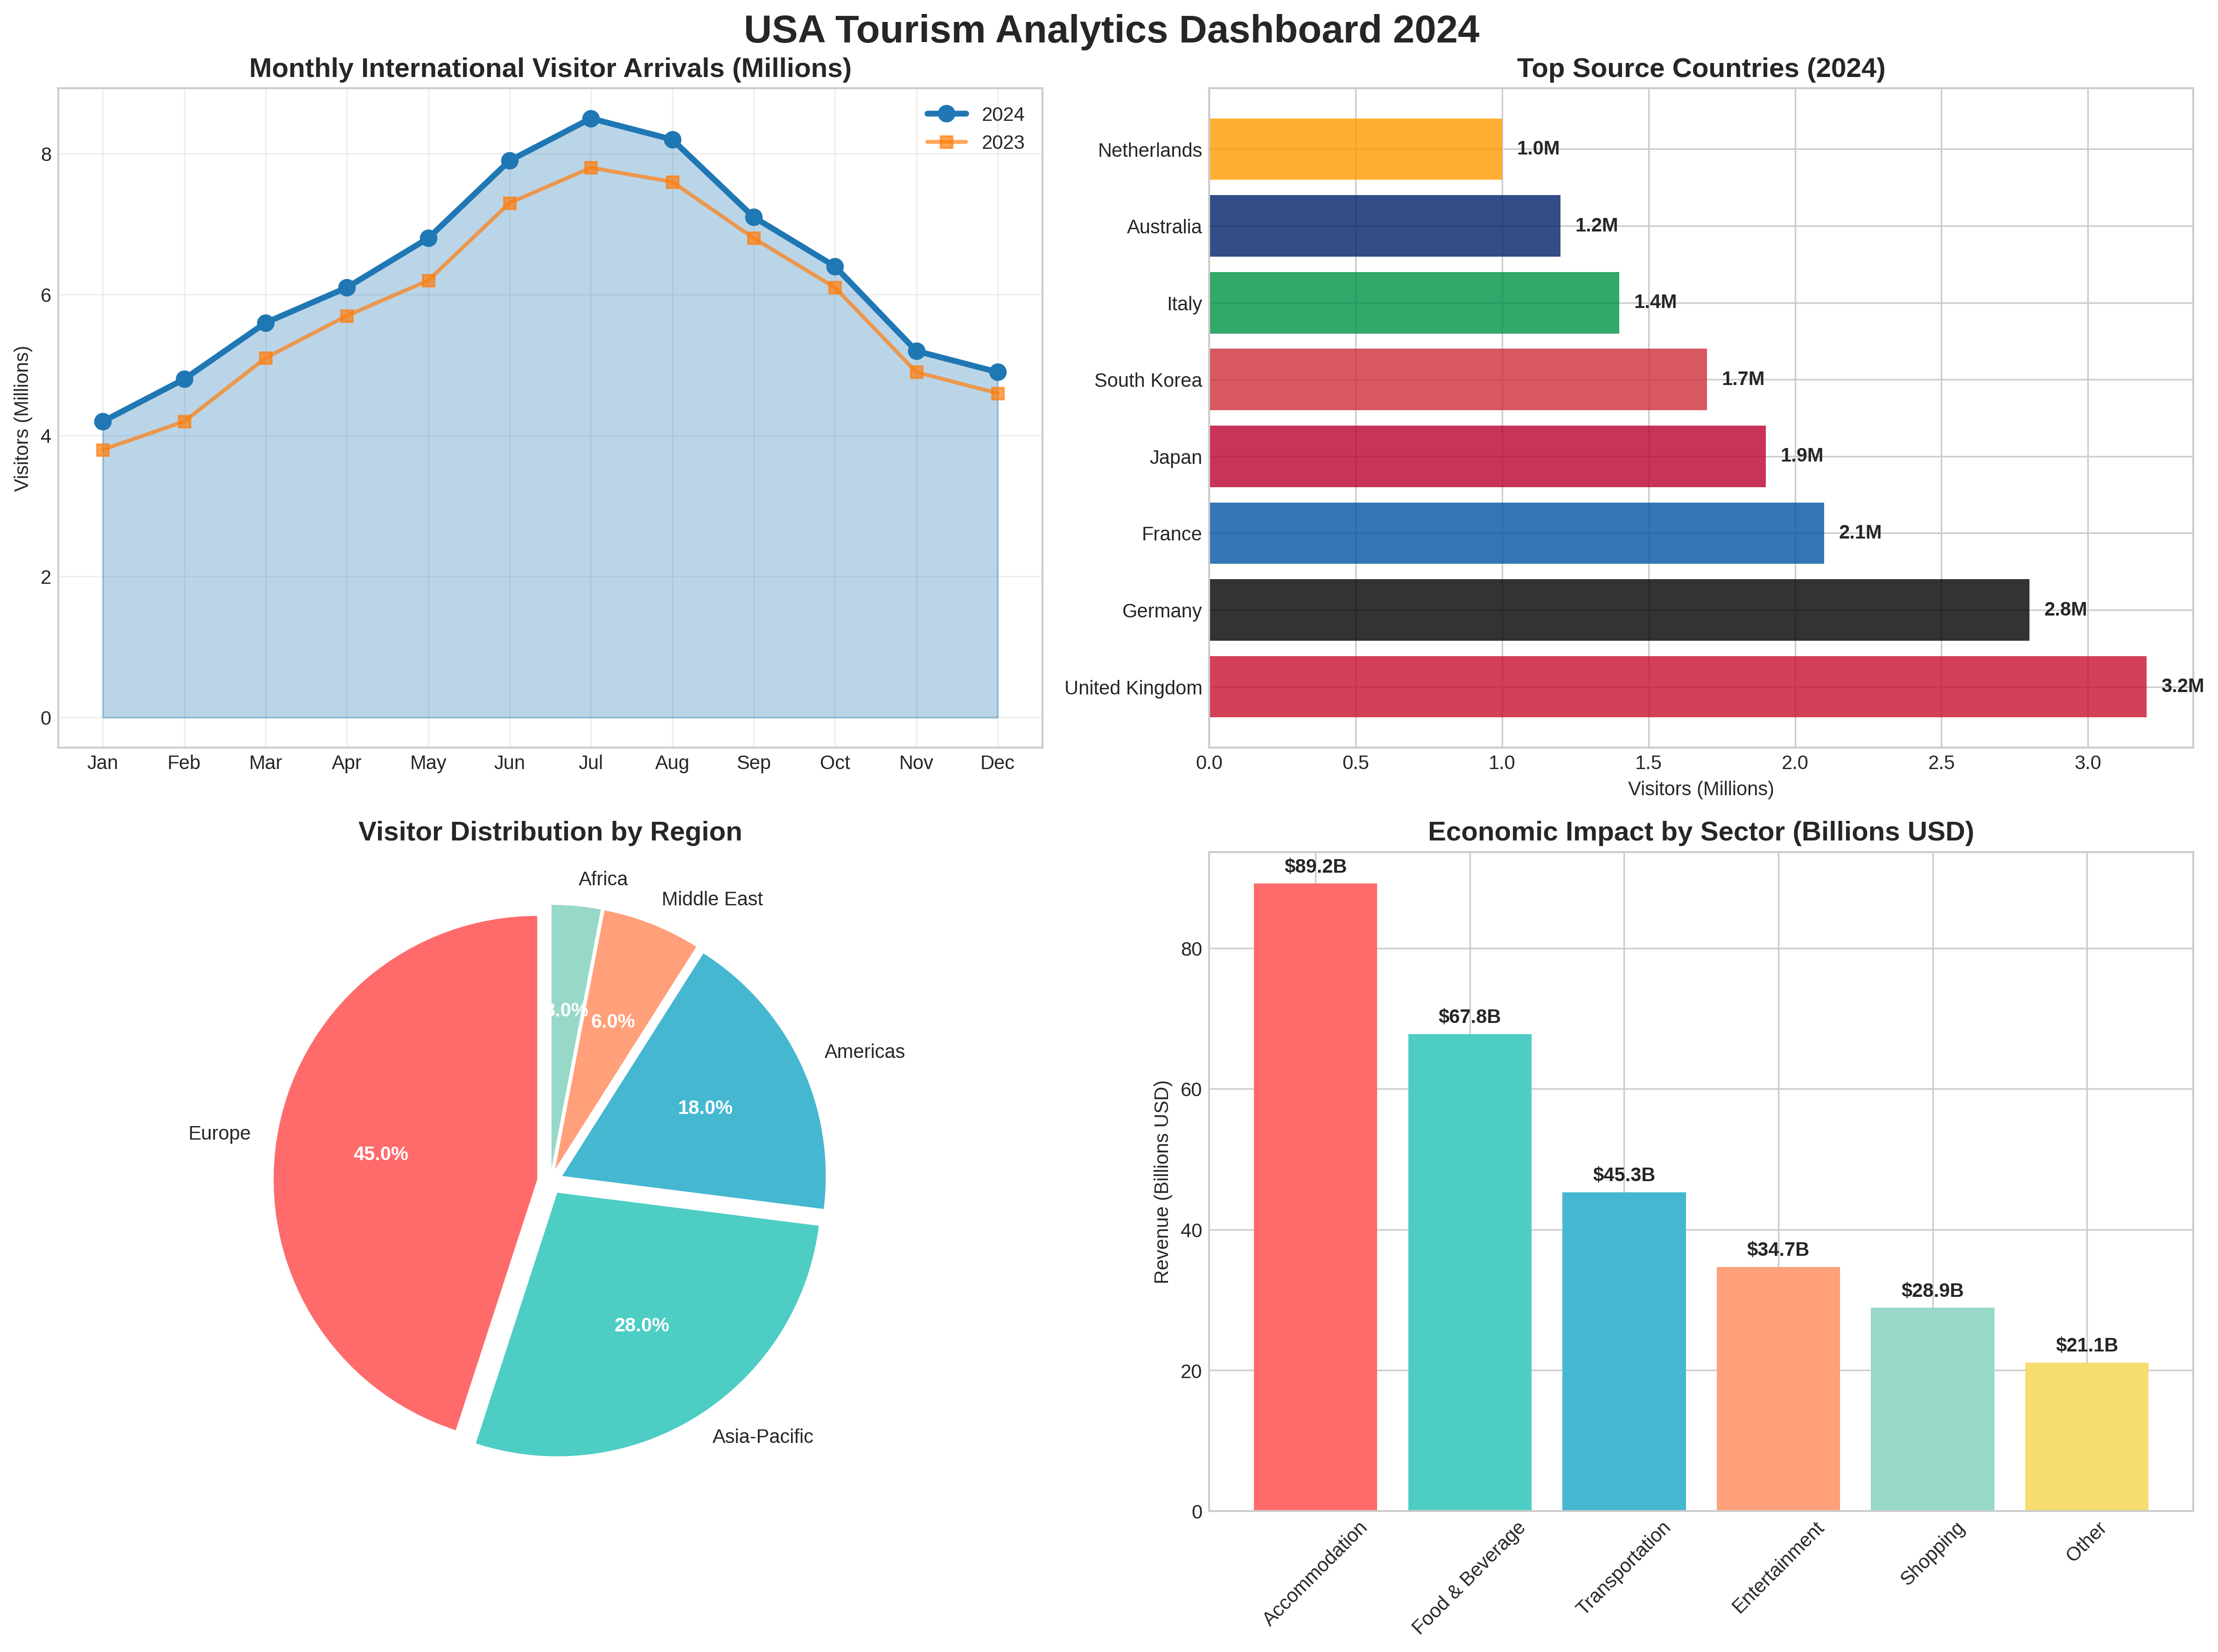
July-August with 8.5M visitors
United Kingdom (3.2M visitors)
Europe accounts for 45% of visitors
Accommodation sector: $89.2B revenue
Detailed analysis of ESTA application processing and performance metrics
Processing times, approval rates, application volumes, and method preferences
50% processed within 4 hours
Japan leads with 99.5% approval rate
95,000 applications in July 2024
65% use online portal
Market size projections, demographic insights, and seasonal patterns
Growth projections, traveler demographics, seasonal demand, and travel purpose analysis
Projected $412B by 2027
26-35 age group (28% of visitors)
Q3 shows highest demand (145 index)
Leisure tourism dominates (68%)
Regional visitor patterns and top cities of origin
Regional distribution patterns and top 20 cities contributing to USA tourism
Western Europe (45.2% of visitors)
London contributes 2.8M visitors
East Asia represents 18.3% share
Southeast Asia showing rapid growth
State-wise revenue, employment impact, tax contributions, and GDP analysis
Tourism revenue by state, employment generation, tax revenue, and GDP contribution trends
California generates $89.2B revenue
Restaurants sector: 2.1M jobs
Federal income tax: $28.4B
2.9% contribution to national GDP
Explore data with our interactive analysis tools
Filter tourism data by country, time period, visa type, and other parameters to create custom insights.
Analyze historical trends and generate forecasts for tourism patterns and market developments.
Generate custom reports with selected metrics and visualizations for presentations and analysis.
Transparency in our data collection and analysis methods